Back to Senior Level
Kafka Visualization
Prerequisite
- Experience working in a data platform engineering capacity dealing with data streams
- Integrating pipelines
Challenge
You have been hired by ACME Corp, to visualize streams of data coming from devices in the ocean. Your point of contact has asked you to ingest the raw streaming data from these devices and visualize it on a map and show how the devices move in the ocean over time.
The Task
- The data is streamed daily and you are provided data for Day 1 and Day 2.
- The data can be picked up from here for Day 1 and Day 3
- It is a fat JSON file that contains the location information from 90 devices in the ocean. Each device has a unique
spotterId. - The structure of the json is as below:
Requirements
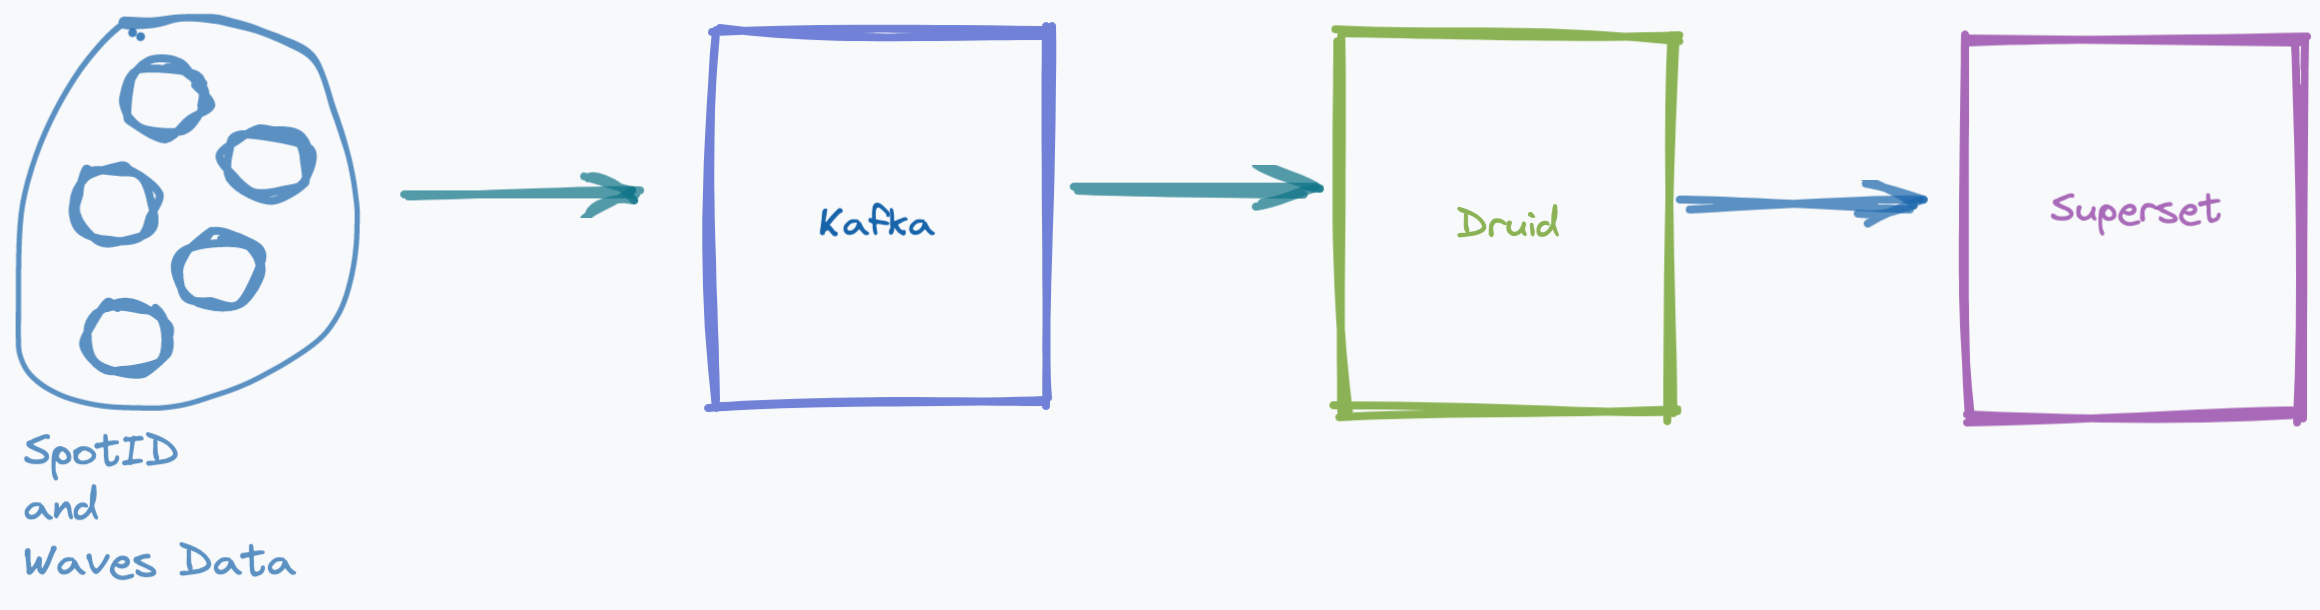
- Prepare a docker compose that contains the following: Confluent Kafka, Apache Druid, and Apache Superset
- Publish Day 1 data into Kafka topic
ocean-data - Connect this kafka topic to Apache Druid
- Connect Apache Superset to the Druid database
- Pick a Map dashboard from Superset and show the latitude / longitude locations of the ocean devices
- Publish Day 2 data into the same topic
- Refresh the Map dashboard in superset to now see day 2 data on the map
Deliverable
- A GitHub repo with read permissions given to GitHub users
rafty8s,bsneider,omnipresent07, andbarakstout(how to invite collaborators) - The repo should have enough README.md instructions
- A docker-compose.yml using which everything can be spun up
- Any additional commands that need to be executed
